
EO4Health Virtual Observatory
Getting started with the EO4Health Virtual Observatory
The EO4Health Resilience Project leverages Earth Observation (EO) data to support public health and environmental resilience, particularly in regions vulnerable to climate-sensitive diseases. By integrating satellite-derived environmental indicators with epidemiological models, the project provides timely, location-specific insights into the risks of vector-borne and water-borne diseases.
Its goal is to enhance early warning systems, inform health interventions, and support decision-making for disaster preparedness and climate adaptation, with a strong focus on data accessibility and collaboration across scientific and policy communities.
EO4Health Viewer
The EO4Health Viewer is an interactive platform designed to visualize Earth Observation data pertinent to public health. It plays a crucial role in making EO and geospatial data accessible to non-expert users, including public health officials, decision-makers, and humanitarian workers.
By offering an intuitive, web-based interface, it allows users to visualize, explore, and interpret complex EO datasets without needing technical expertise in remote sensing or GIS. This accessibility bridges the gap between advanced scientific data and real-world application, empowering users to make informed decisions on health risk monitoring, environmental management, and climate resilience—especially in regions with limited technical capacity.
Follow these guidelines (partial, yet representative) to explore the various datasets and tools on the platform, made available in the scope of ESA’s EO4Health Resilience project.
Accessing the EO4Health Viewer
- Navigate to: https://eo4health.viewer.brockmann-consult.de
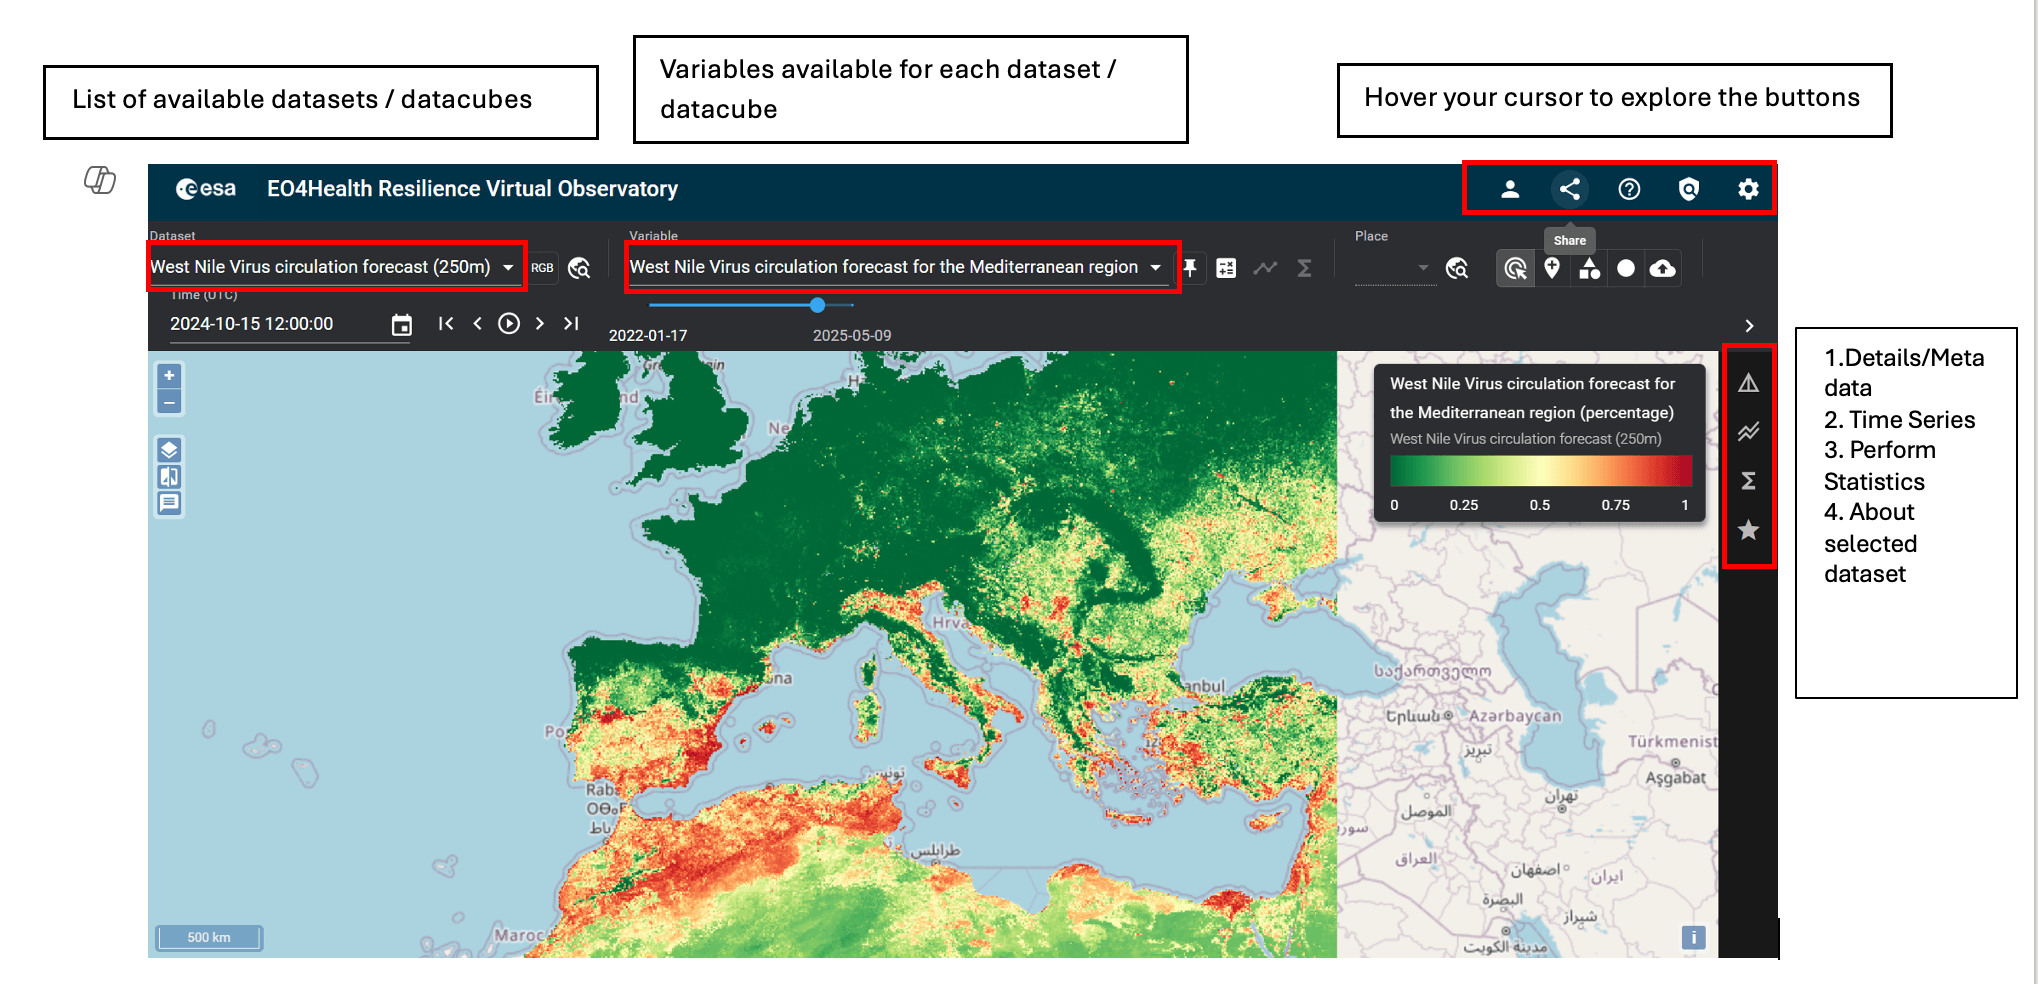
Interface Overview
- Main Map Area: Central display showing geospatial data.
- Top Toolbar: Tools for navigation and settings.
- Left Panel: Dataset selection and layer management.
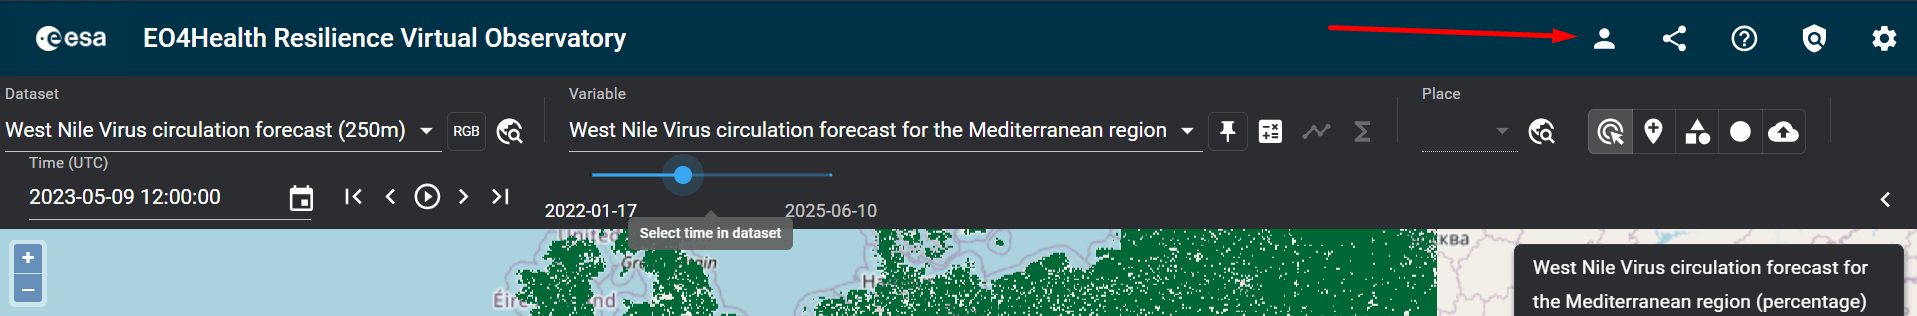
Accessing the Confidential Part of the Platform
Accredited users have access to private datasets that, for various reasons, cannot be made publicly available. To log in, simply click the “login” button located on the right side of the top toolbar.
Once logged in, users gain access to all datasets available in the EO4Health Viewer.
Selecting, Managing and Visualizing Datasets
- Dataset Selection:
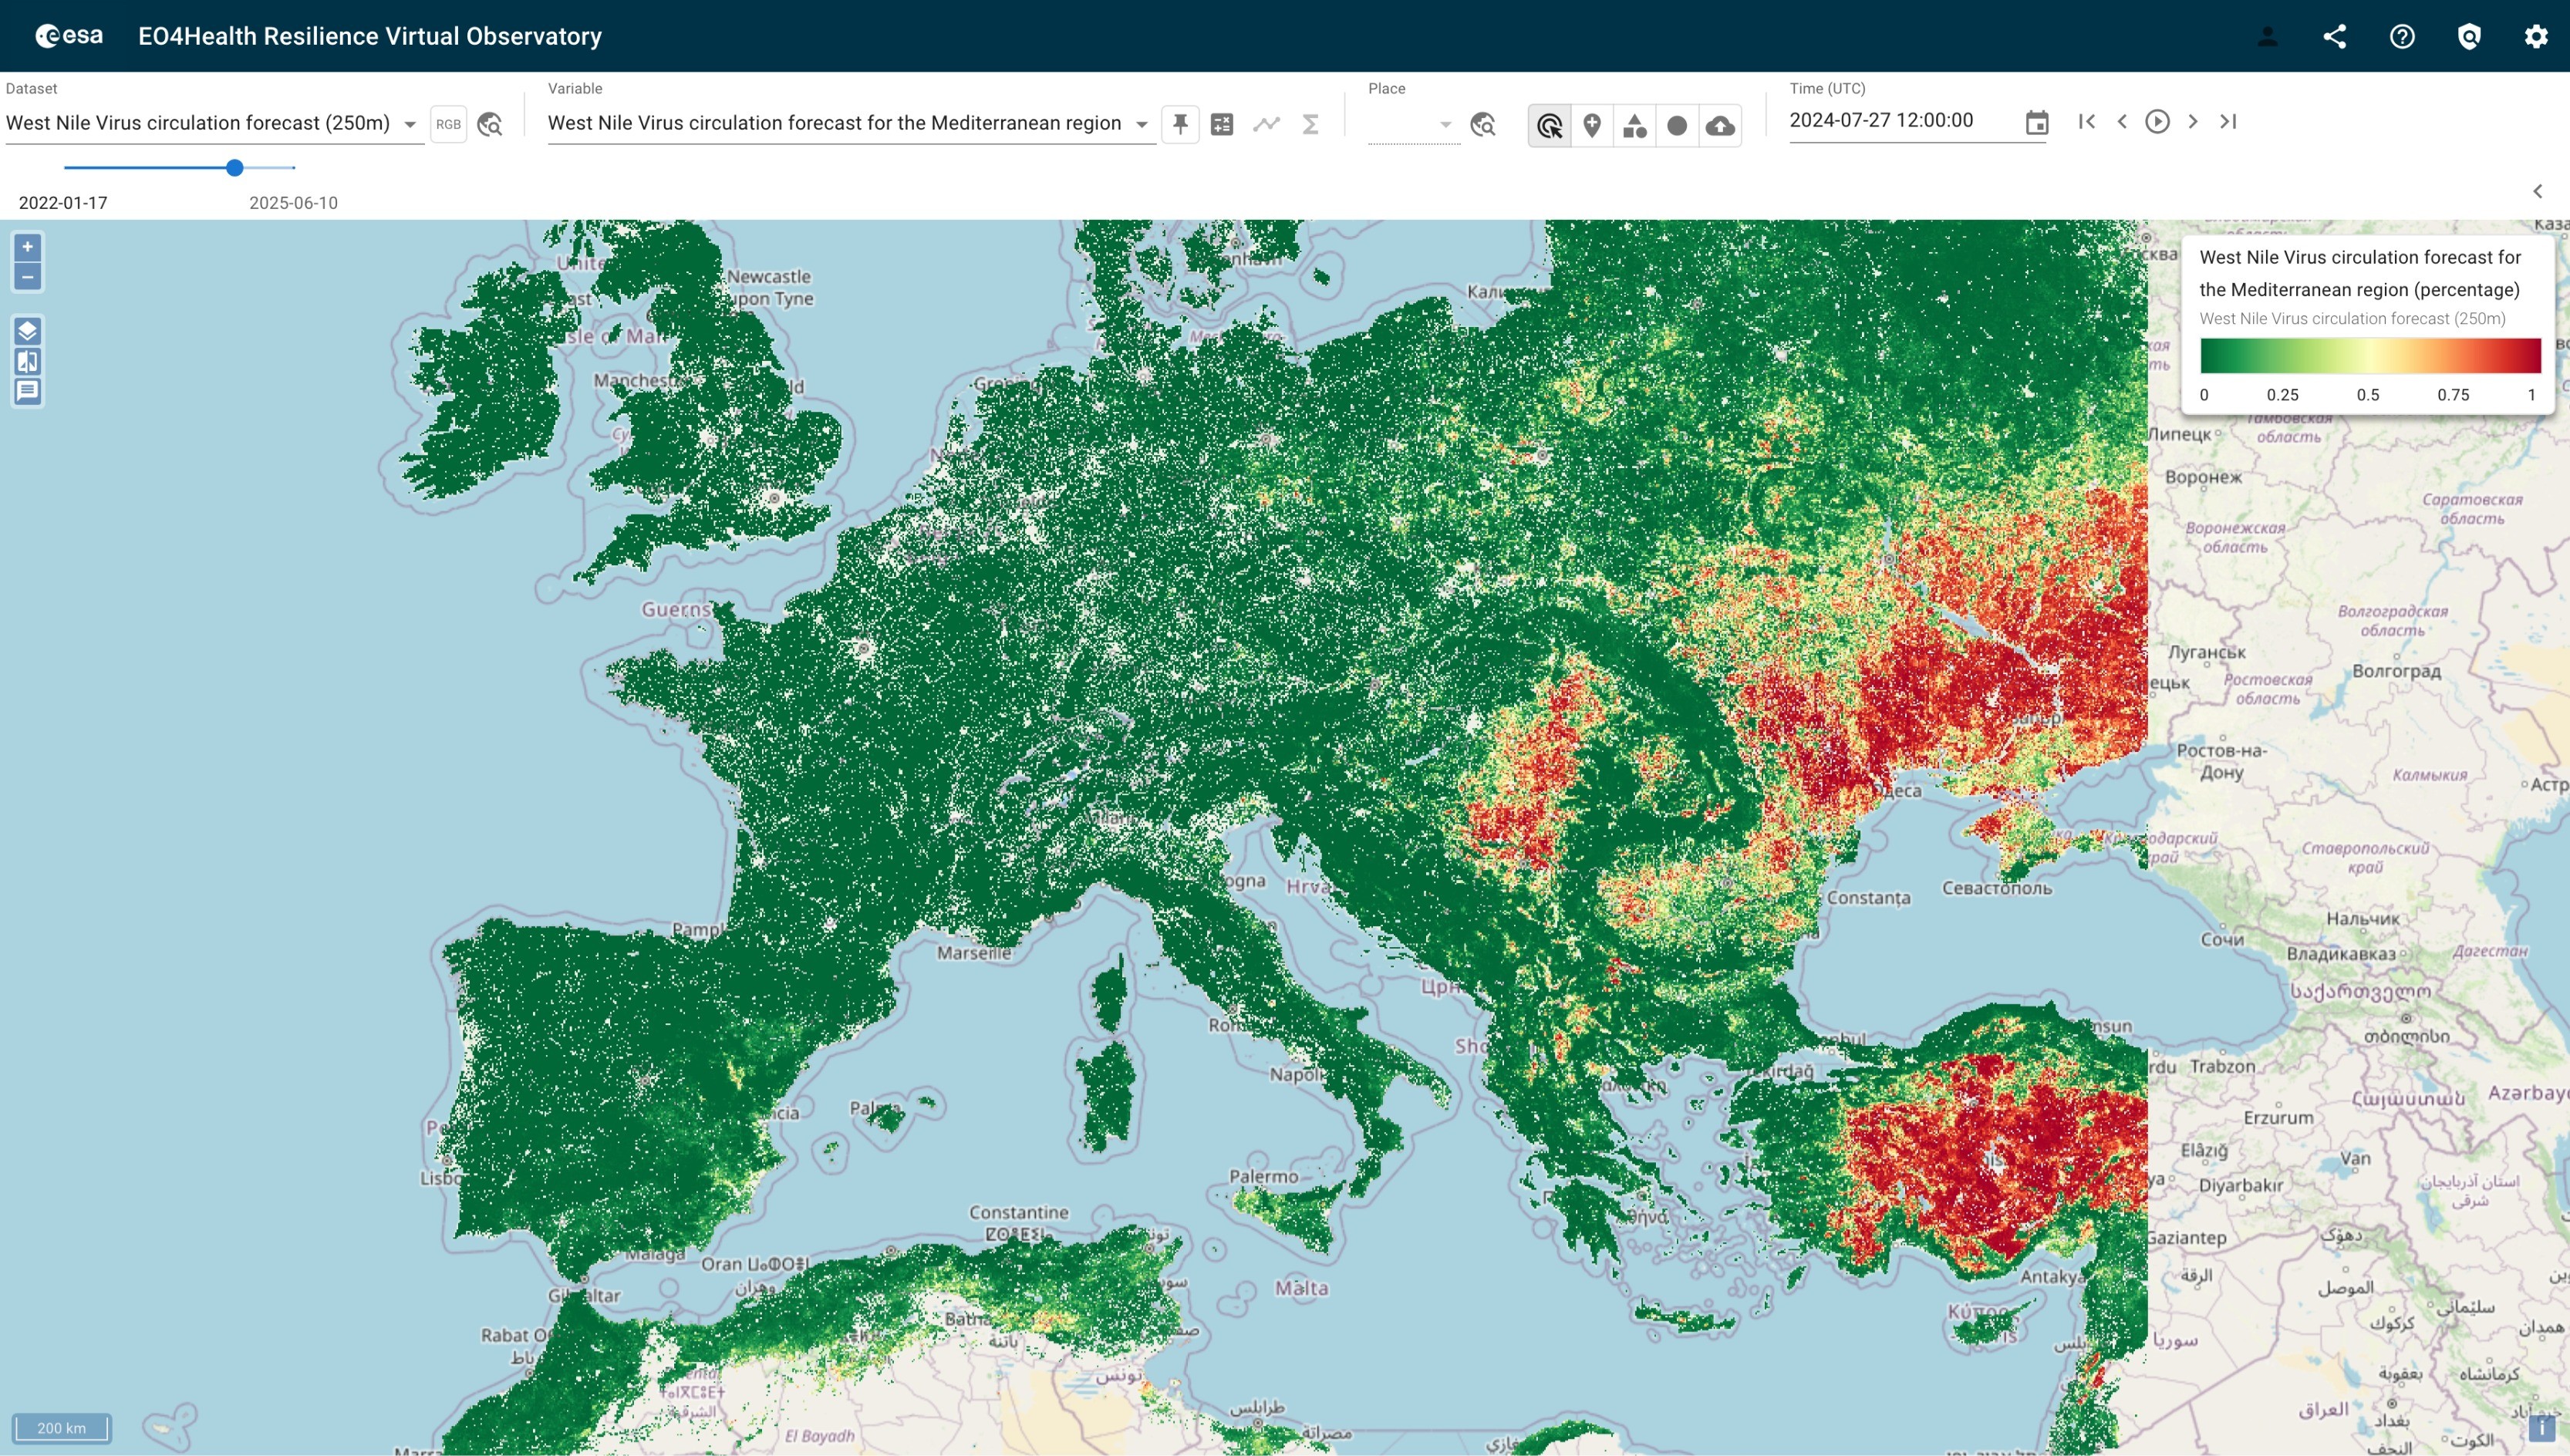
In the left panel, click on datacubes such as West Nile Virus circulation forecast (250m), Vembanad Lake E. Coli Concentration, or Milan Air Pollution to load them onto the map. - Variable Selection:
Some datasets include multiple variables. These can be selected from the dropdown menu located to the right of the dataset name.
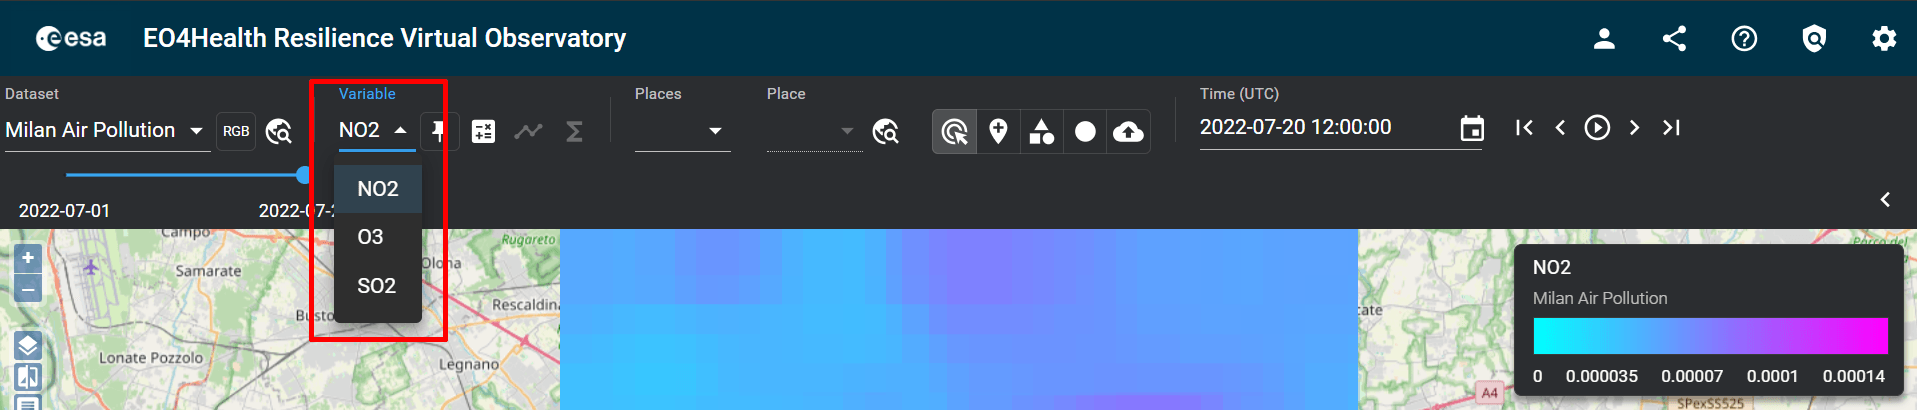
- Info Box Activation:
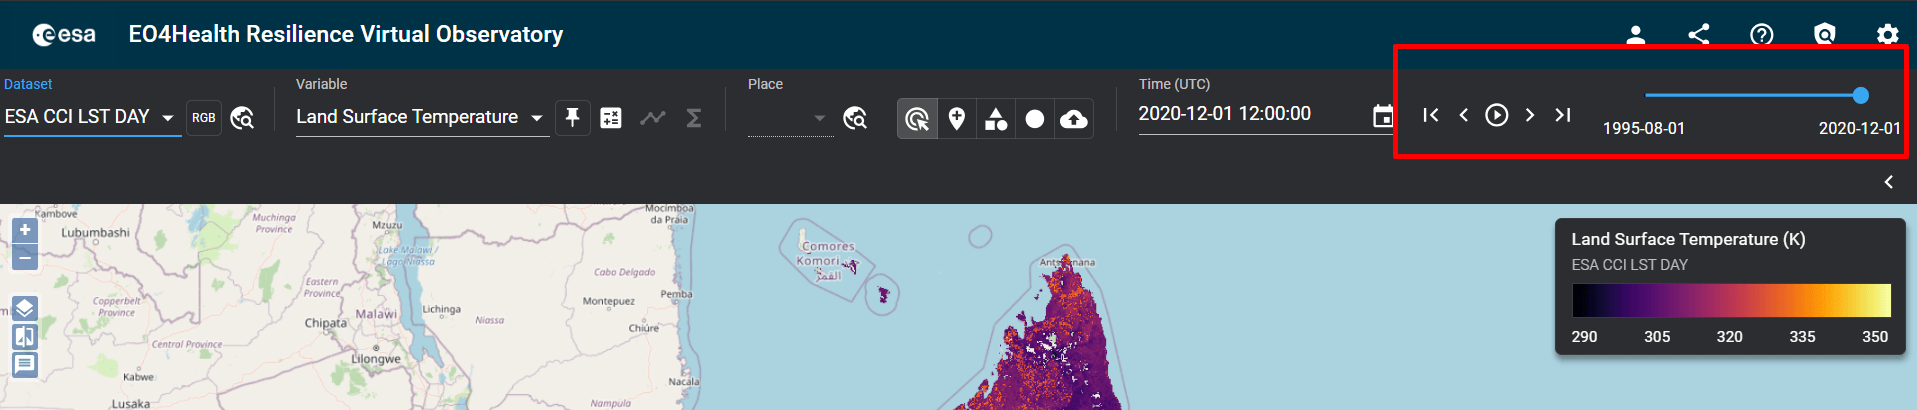
To view real-time values from each variable, enable the info box. As you move your mouse over the map, actual data values will be displayed dynamically. - Time Series Navigation:
For datasets with time series data, use the time slider in the top toolbar. Navigate forward or backward in time manually or automatically. Available dates are shown as you scroll.
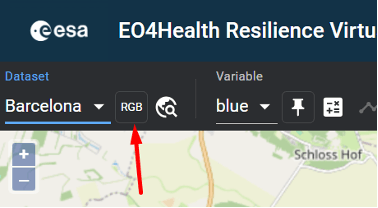
- Displaying Satellite Images (for accredited users):
Satellite datasets offer two visualization modes:- True Colour Images: Use the “RGB” toggle button to display standard satellite imagery.
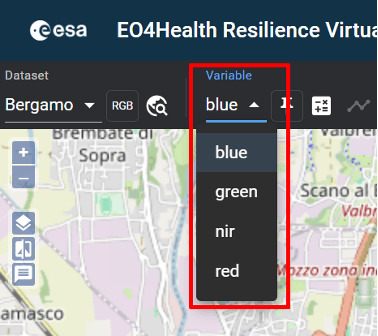
- Spectral Bands: View individual spectral bands listed in the variable list for each image.
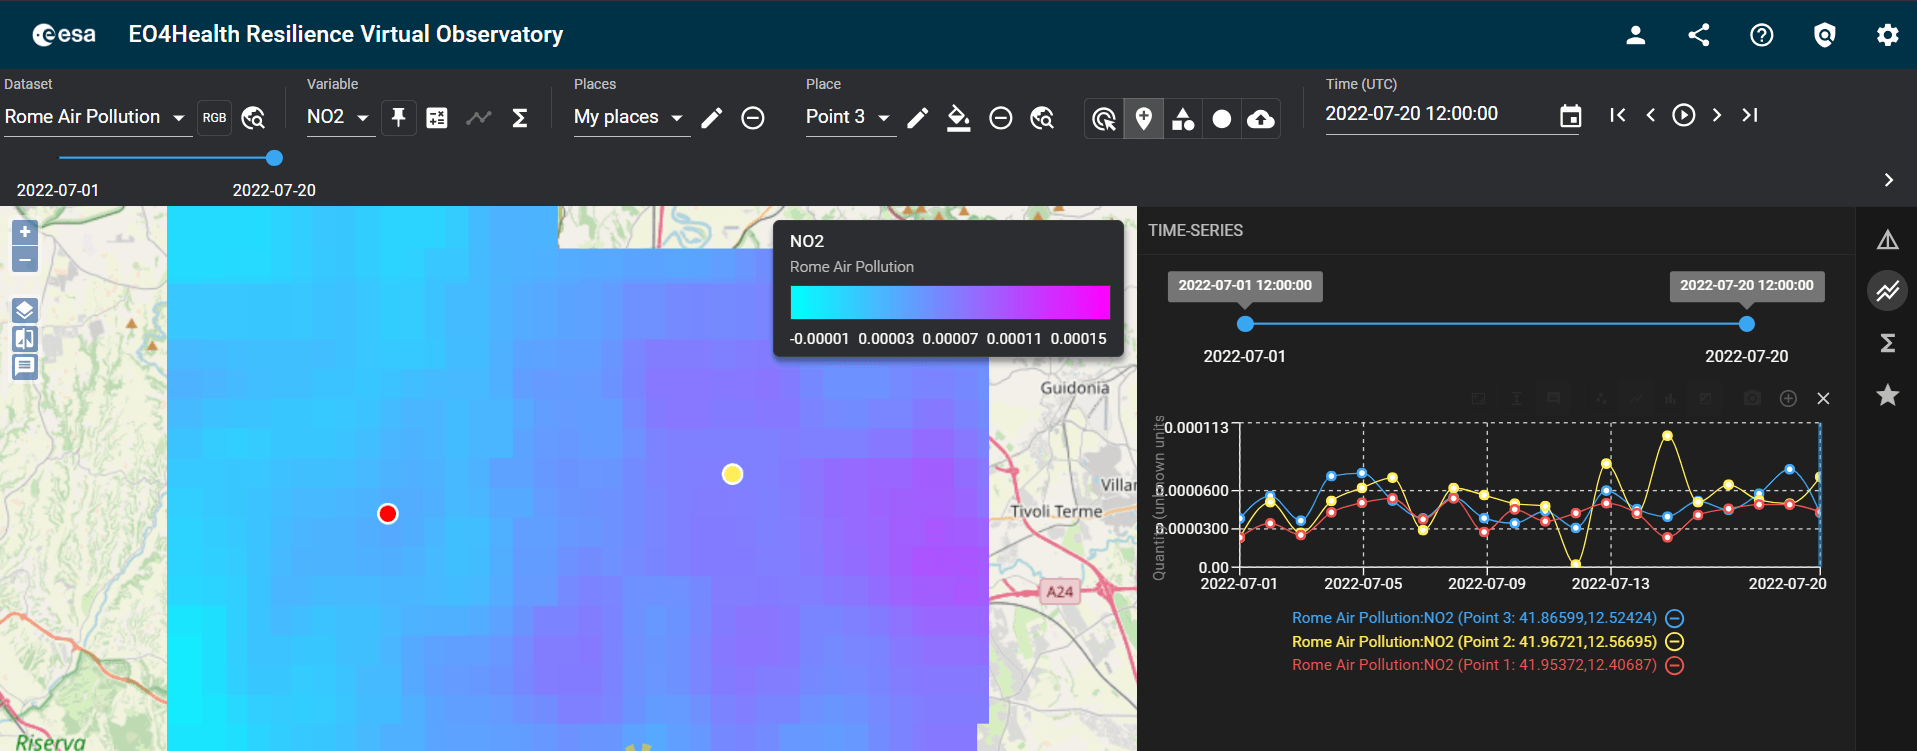
- Data Selection and Plotting:
Users can extract values and visualize them in graphs for better understanding, especially for time-series analysis.
Use the “Add a point location in map” feature to click on the map and generate a graph in the left panel. Each point is color-coded for easy identification on both the map and the graph.
- Data Symbology:
Datasets are displayed using default symbology optimized for clarity. Users can customize this by:- Clicking on the symbology in the legend box.
- Choosing from a wide range of color palettes.
- Adjusting layer opacity.
- Inverting color ramps.
Click on the colour ramp → Choose the desired palette → Adjust display options
Utilizing Additional Map Tools and Information
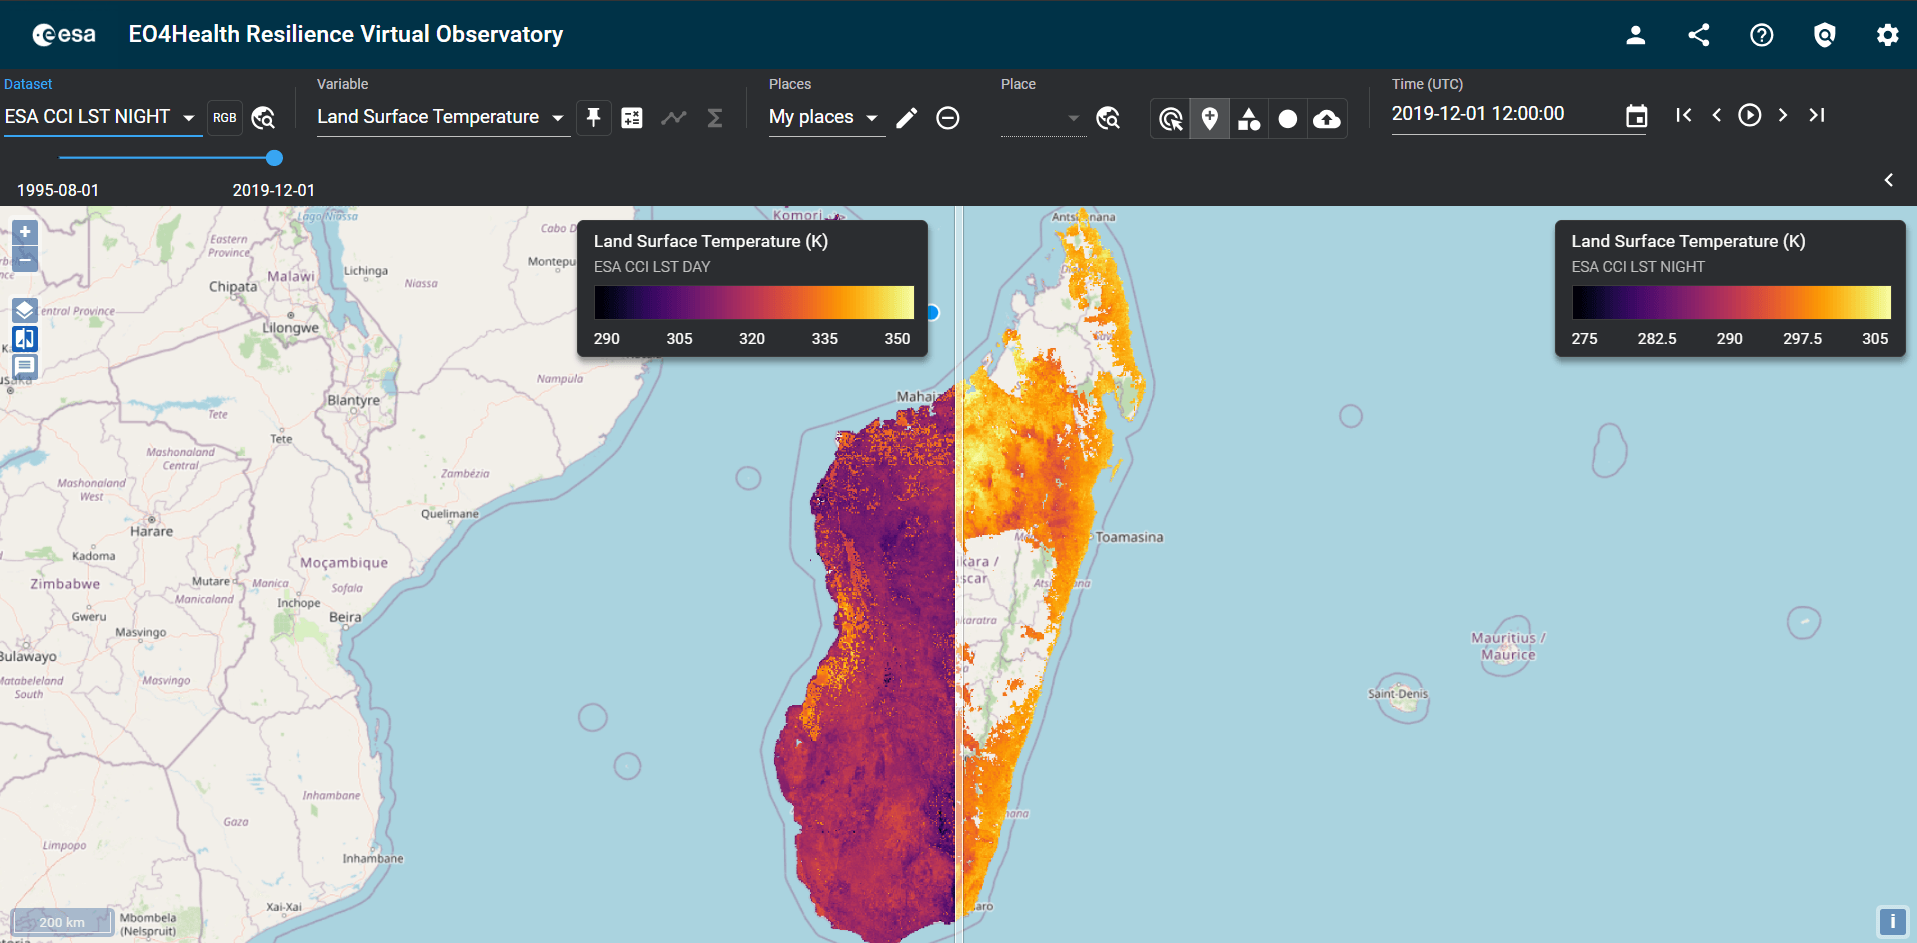
- Split Layers:
Compare datasets using the split layer option in the right-side panel.
Example: Day (left) and night (right) land surface temperature over Madagascar.
- Settings:
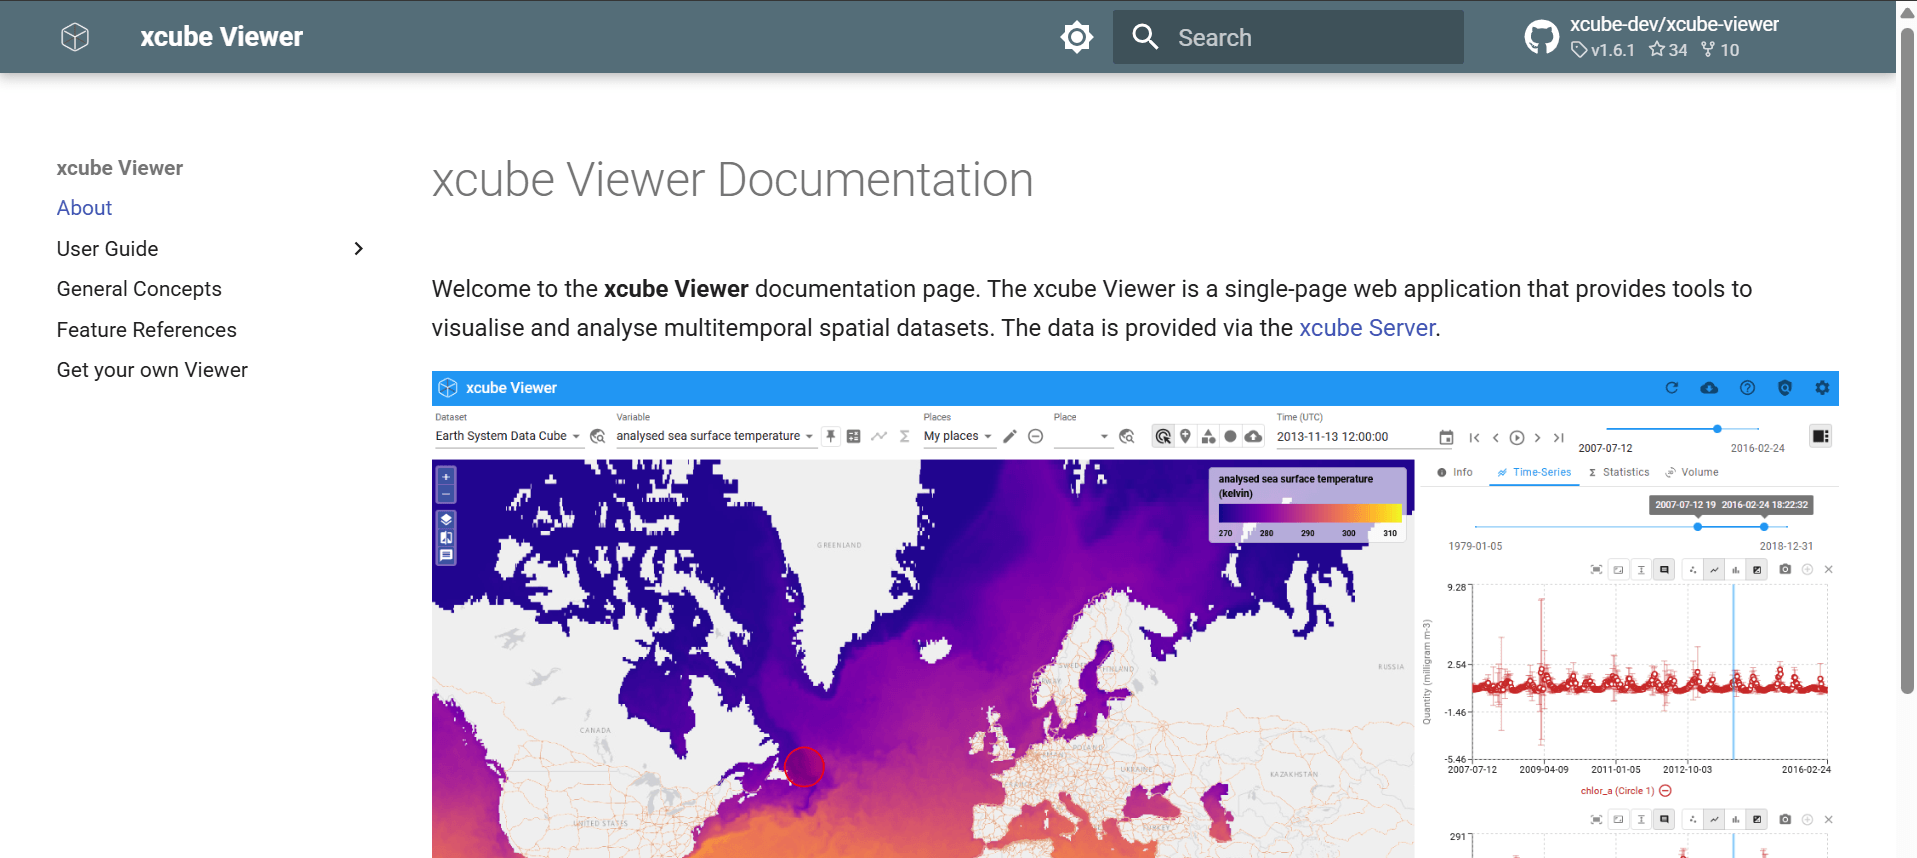
Customize language and other preferences via the Settings menu. - Viewer Documentation:
Access the Help section within the EO4Health Viewer for additional guidance.
Clicking the “Documentation” link redirects to the xcube Viewer Documentation webpage, which provides a comprehensive explanation of all platform functionalities.
Note: Screenshots referenced are illustrative. For actual visuals, please visit the EO4Health Viewer directly at
https://eo4health.viewer.brockmann-consult.de
List of Available Layers
| Dataset | Layer | Description | Access Policy | Link |
|---|---|---|---|---|
| Vector Borne Diseases Datasets | West Nile Virus circulation forecast (250m) | Focused on vector-borne diseases and based on the model developed by IZSAM in the AIDEO project to predict areas at risk for WNV circulation in Italy. Period covered: from 2022/01/17 | Public | Link |
| Bologna NDVI | WorldView based NDVI for Bologna. Reference date: 2023/04/06 | Public | Link | |
| Campobasso NDVI | WorldView based NDVI for Campobasso. Reference date: 2021/07/06 | Public | Link | |
| Water Borne Diseases Datasets | Baltic Sea Vibrio Risk Map (SST based) | EO based Vibrio risk map developed per Baker-Austin et al. (2013). Period covered: 1995/01/01 to 2019/01/01 | Public | Link |
| Vembanad Lake E. Coli Concentration | EO based E. Coli map per Abdulaziz et al. (2023). Period covered: 2018 | Public | Link | |
| Vembanad Lake Flood Maps | Sentinel based flood map. Period covered: 2019/01/12 to 2023/12/17 | Public | Link | |
| Vembanad Lake NDVI | WorldView NDVI over lake Vembanad. Reference date: 2024/02/17 | Public | Link | |
| Vembanad Lake Cholera Risk Map (North) | EO based Cholera risk map per Anas et al. (2021). Period covered: 2018/09/26 to 2020/03/14 | Private | ||
| Vembanad Lake Cholera Risk Map (South) | EO based Cholera risk map per Anas et al. (2021). Period covered: 2018/09/26 to 2020/03/14 | Private | ||
| Madagascar (Kukula) | ESA CCI LST DAY | ESA CCI land surface temperature (day). Period: 1995/08/01 to 2010/12/01 | Public | Link |
| ESA CCI LST NIGHT | ESA CCI land surface temperature (night). Period: 1995/08/01 to 2019/12/01 | Public | Link | |
| Madagascar Crop Data | Cropland data for Madagascar (2023). Includes cropland areas and irrigation classification. | Public | Link | |
| Land Surface Temperature | Barcelona | EO based LST for Barcelona. Reference date: 2021-08-14 | Public | Link |
| Bonn | EO based LST for Bonn. Reference date: 2021-08-14 | Public | Link | |
| Lisbon | EO based LST for Lisbon. Reference date: 2021-08-14 | Public | Link | |
| Paris | EO based LST for Paris. Reference date: 2021-08-14 | Public | Link | |
| Rome | EO based LST for Rome. Reference date: 2021-08-14 | Public | Link | |
| Air Pollution | Milan Air Pollution | EO based air pollution for Milan. Variables: NO2, O3, SO2. Period: 2022/07/01 to 2022/07/20 | Public | Link |
| Rome Air Pollution | EO based air pollution for Rome. Variables: NO2, O3, SO2. Period: 2022/07/01 to 2022/07/20 | Public | Link | |
| Environmental Variables | Monthly Sum Rainfall (CHIRPS dataset) | Monthly rainfall totals from CHIRPS. Period: 1981/01/31 to 2024/04/30 | Public | Link |
| Florence | Florence tree species | EO based tree species classification (5 species). Reference date: 2018-09-06 | Public | Link |
| Pollen Distribution | EO based pollen distribution per month. Reference date: 2018-09-06 | Public | Link | |
| SPOT Satellite Images | Barcelona | SPOT image of Barcelona. Reference date: 2022/07/25 | Private | |
| Bergamo | SPOT image of Bergamo. Reference date: 2022/09/18 | Private | ||
| Bratislava | SPOT image of Bratislava. Reference date: 2022/06/03 | Private | ||
| Florence | SPOT image of Florence. Reference date: 2022/07/22 | Private | ||
| Kosice | SPOT image of Kosice. Reference date: 2022/07/20 | Private | ||
| Lisbon | SPOT image of Lisbon. Reference date: 2021/03/18 | Private | ||
| Madrid | SPOT image of Madrid. Reference date: 2022/04/07 | Private | ||
| Milan | SPOT image of Milan. Reference date: 2020/08/05 | Private | ||
| Vembanad Lake (2019) | SPOT image of Vembanad Lake. Reference date: 2019/02/14 | Private | ||
| Vembanad Lake (2021) | SPOT image of Vembanad Lake. Reference date: 2021/02/10 | Private | ||
| Vembanad Lake (2022) | SPOT image of Vembanad Lake. Reference date: 2022/02/23 | Private | ||
| Vembanad Lake (2023) | SPOT image of Vembanad Lake. Reference date: 2023/01/10 | Private | ||
| Pleiades Satellite Images | Bergamo | Pleiades image of Bergamo. Reference date: 2021/05/18 | Private | |
| Bratislava | Pleiades image of Bratislava. Reference date: 2021/06/16 | Private | ||
| Milan | Pleiades image of Milan. Reference date: 2022/04/08 | Private | ||
| Rome | Pleiades image of Rome. Reference date: 2022/03/21 | Private | ||
| PlanetScope Satellite Images | Campobasso | PlanetScope images for Campobasso. Period: 2020/04/08 to 2023/12/22 | Private |